Introduction
The future of energy is here, and it’s called exergoeconomic optimization. This revolutionary tool is set to transform the way we approach district heating and cooling (DHC), offering unprecedented efficiency and sustainability. This article delves into the intricacies of this tool (preliminary version) and its application in the 4th and 5th generation DHC systems.
The Hypergryd Project
The Hypergryd project, funded by the European Union’s Horizon 2020 research and innovation programme, is at the forefront of this groundbreaking technology. The project aims to optimize DHC systems using exergoeconomic principles, paving the way for a more sustainable and efficient future.
The Exergoeconomic Optimization Tool
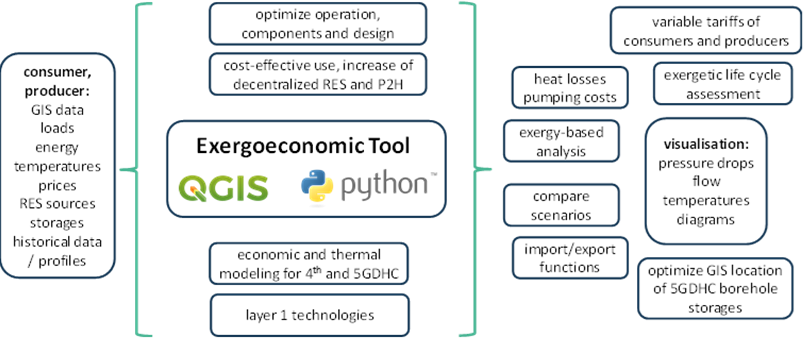
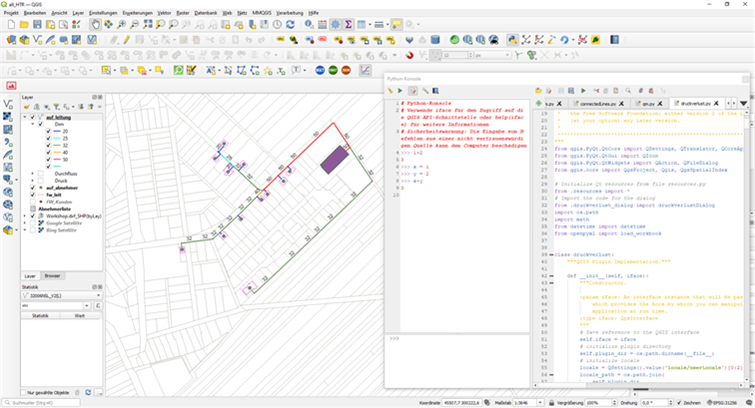
The exergoeconomic optimization tool is a sophisticated system designed to enhance the performance of DHC systems. It uses advanced algorithms and Geographic Information System (GIS) data to calculate the most efficient configurations for DHC grids.
Network Geometry and Connections
The tool begins by analyzing the geometry of the network, identifying single and polygon lines. It then assigns predecessors and successors to each line, creating a minimum spanning tree. This process ensures that each line has exactly one predecessor, optimizing the flow of energy through the grid.
Node Generation and Customer Integration
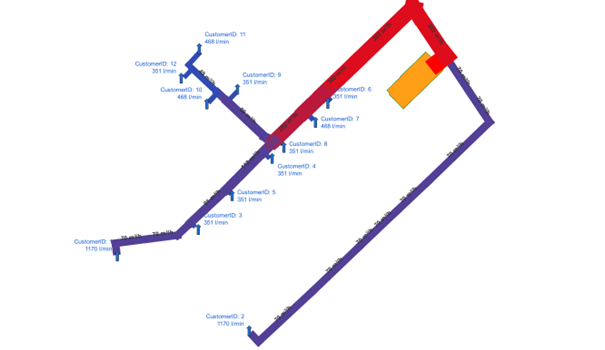
The tool also generates nodes at the endpoints of single lines, creating a comprehensive network of edges and nodes. It then integrates the customer layer into the network, storing the geometry and connection power of each customer in the grid. The tool can handle both single point and polygon geometries, offering flexibility in DHC grid design.
Grid Dimension Calculation
Once the network structure is established, the tool calculates the dimensions of the grid. It saves the results for each time point as a separate layer, creating distinct layers for the grid lines, nodes, and customers. These layers can be visualized, exported, or used for further calculations in QGIS.
Conclusion
The exergoeconomic optimization tool (preliminary version) offers a promising solution for enhancing the efficiency and sustainability of DHC systems. By harnessing the power of this tool, we can unlock the full potential of the 4th and 5th generation DHC, leading the way towards a more sustainable future.
Writen by Christian Doczekal from GET